| HOME | Print RLs | N E X T ››› |
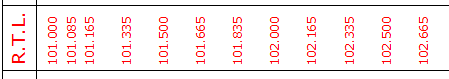
Purpose of this command is to draw RL values in L section from existing profile or P line.
Give 'LS_PRINTRL' command or select it from 'LSext' of 'CSx' menu:
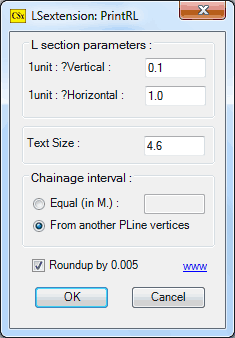
Check values, present in edit boxes.
Make sure that values for '1unit : ?Vertical' and '1unit : ?Horizontal'
should be equal to as given in L section.
Select 'From another PLine vertices' radio button for 'Chainage interval'.
If you select 'Equal (in M.)' radio button, then RLs of uneven intervals are ignored.
'From another PLine vertices' radio button gives a chance to user to select a GL profile to take intervals from that.
Click 'OK' button.
Following message will display in command prompt area:
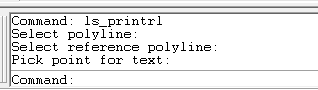
Select polyline: Select a Red line.
Select reference polyline: Select a Green line which is GL centre.
Pick point for text: Pick point bellow a text as 'R.T.L.'.
Top Next